I ran my first marathon this past year.
Over the holidays, I used Claude Code to visualize all my Strava running activities.
I’ve been using Claude Code for everything these days and when I discovered you can easily get an archive of all your Strava GPX activity tracks, I couldn’t help but get nerd sniped into doing a fun little data visualization project.
Usually Mapbox is an easy way to quickly get GPS data visualized, but I wanted to capture the hill I had to climb every run and they don’t have a way of visualizing elevation data interactively in 3D. So, I found the data and built my own map.
I found the Digital Elevation Model (DEM) of Seattle and used OpenStreeMap landcover and landuse data to color my map.
With some great vibe coding help from Mr. Claude Code, I was able to process all this data and get it into a Three.js environment and now I’ve got myself a cool little interactive map with all my runs from 2025 on it.
So here’s how I built it:
Strava Data
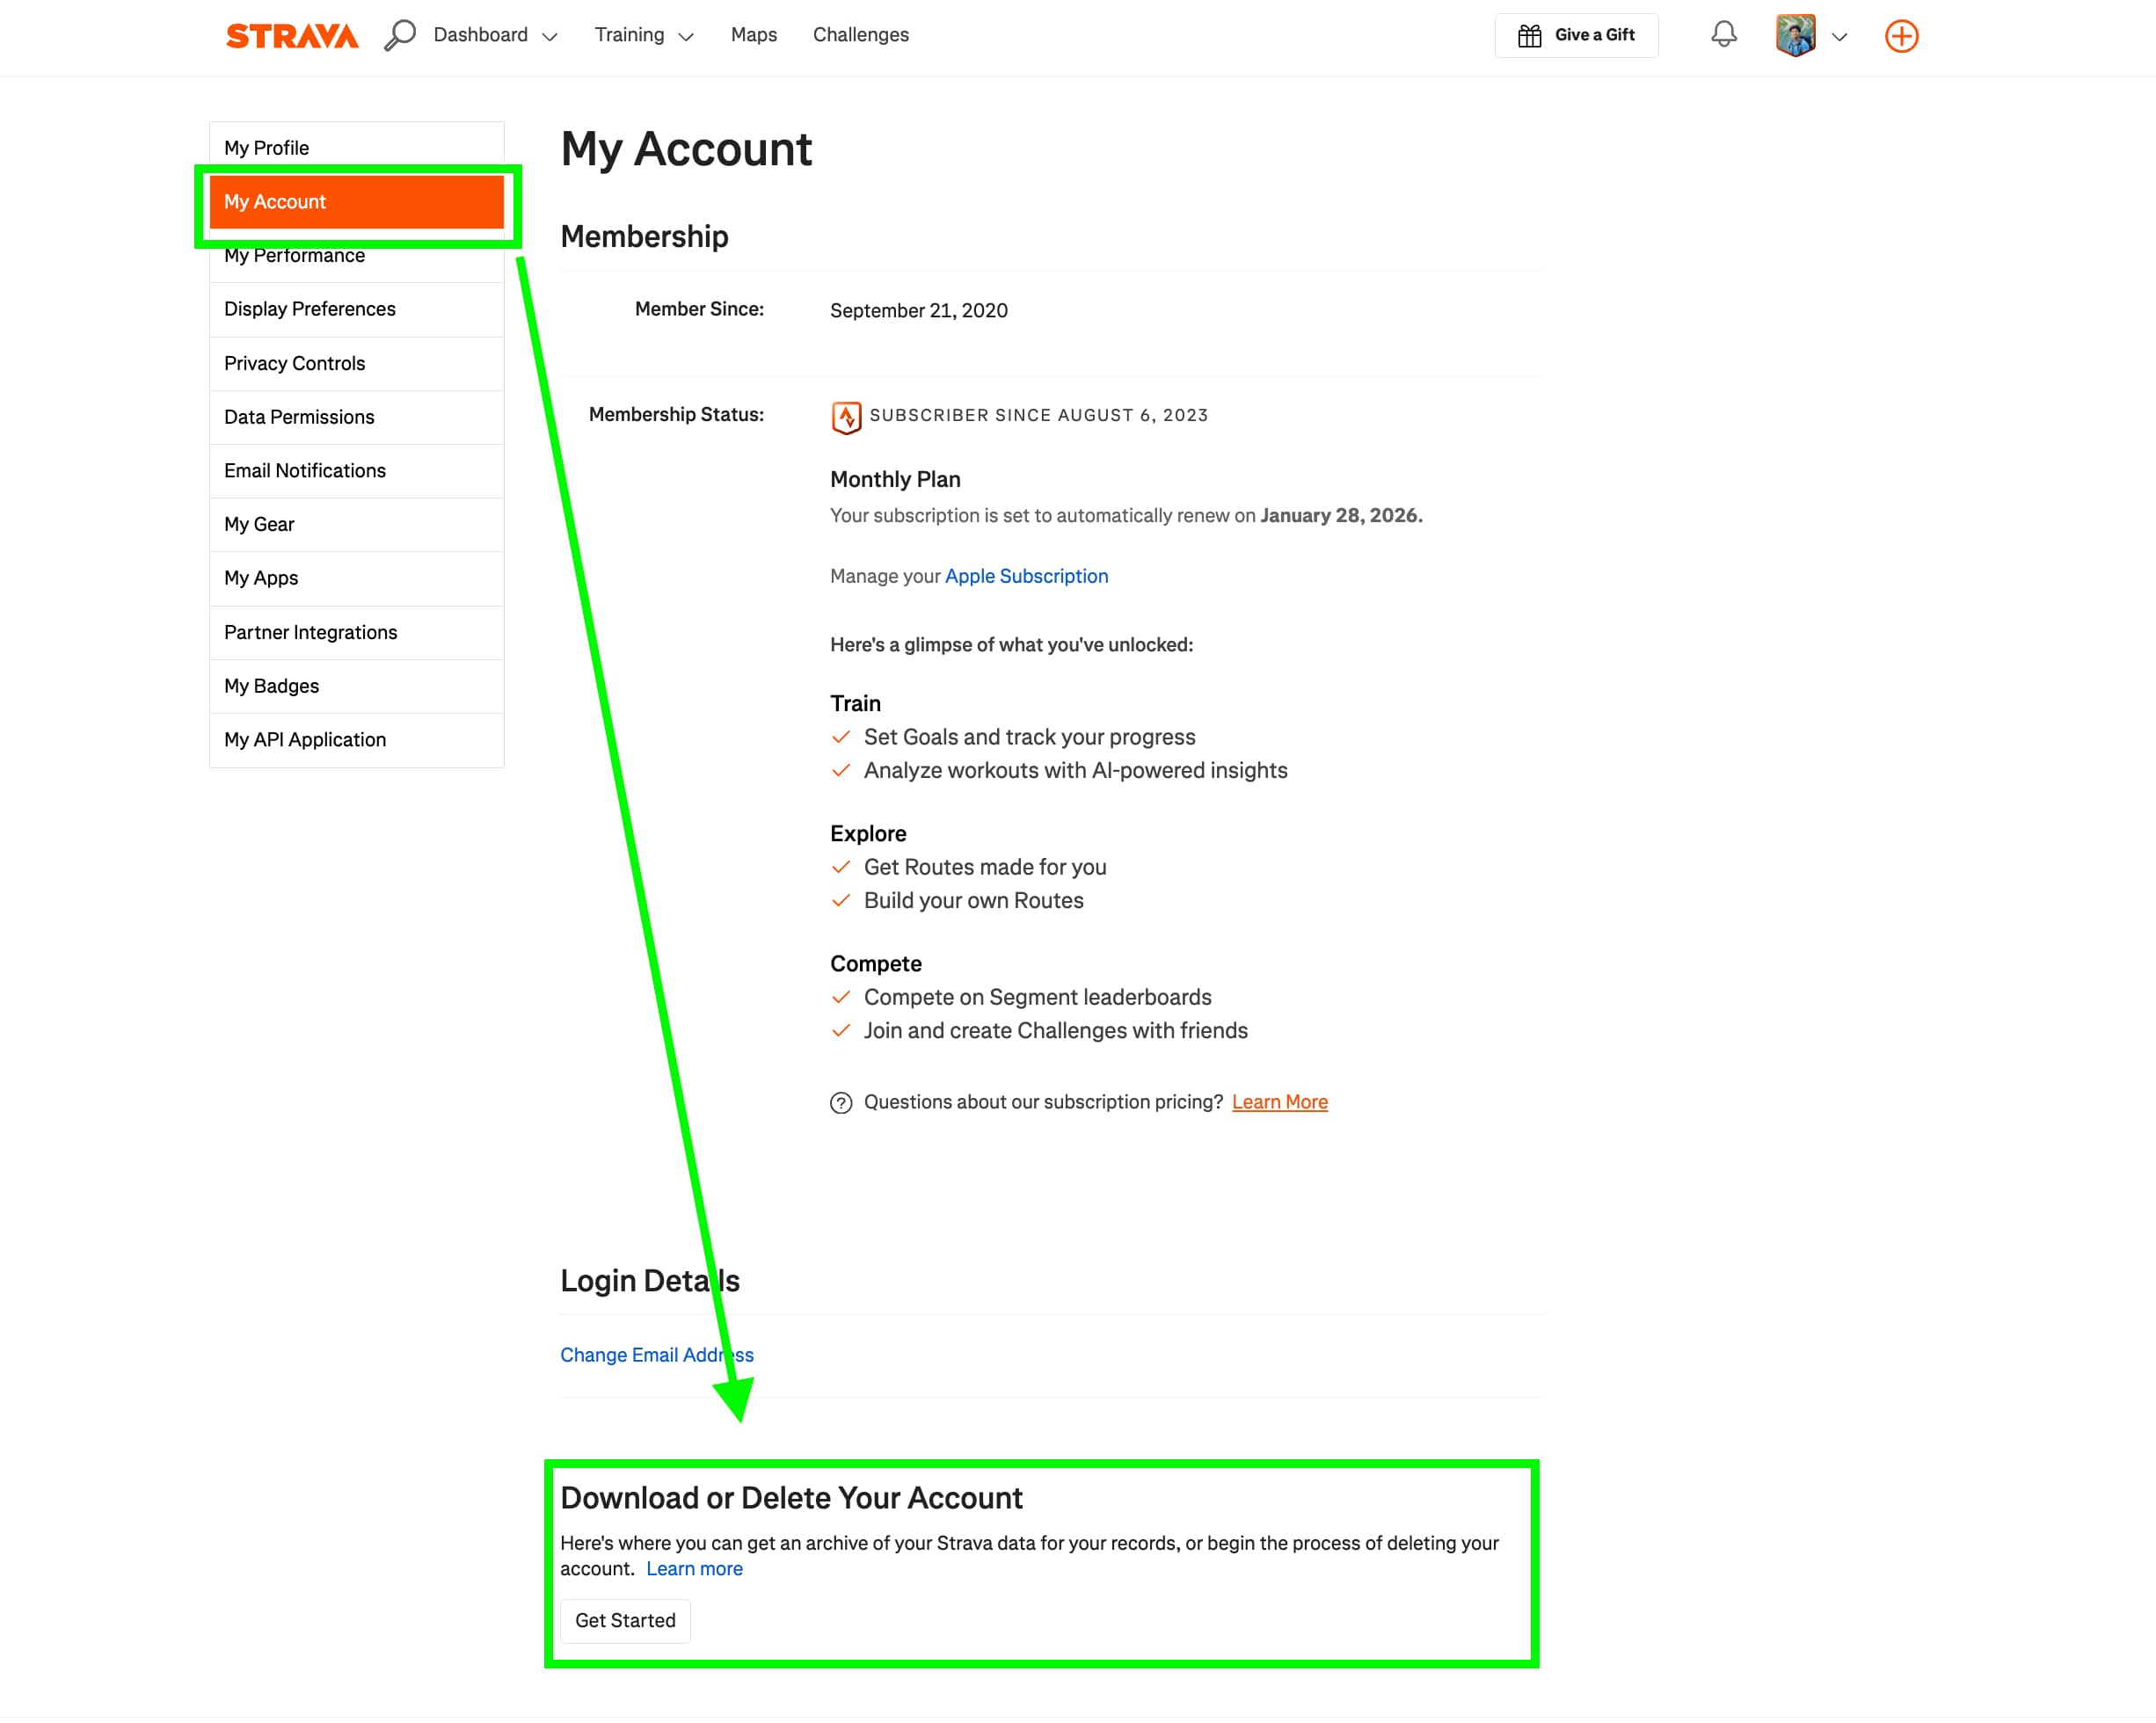
You can easily request to download an archive of all your Strava data. Using the Web UI, navigate to “Settings” > “My Account” and at the bottom section “Download or Delete Your Account”, hit “Get Started”
On the next page, hit “Request Your Archive” and wait around until you get an email

When you unzip that archive, you’ll get a folder with pretty much all the data Strava has on you, but there’s really only two things we really want for visualizing all of our runs:
/                         // strava-export folder
  /activities
    [activity id].gpx
  activities.csv
All the [activity id].gpx files contain the actual GPS tracks of our runs while activities.csv contains all the metadata eg. activity type, distance, duration, etc.
We’ll need to transform the GPX files into a format that we could use to draw Segments in Three.Js and we’ll need to use activities.csv to filter out activities we don’t want to include in our visualization. In my case, that means filtering out activities aren’t in Seattle and filtering out Hiking, Climbing, and Weight Training activities.
Mapping Data
Elevation Data / Digital Elevation Model
I used this Digital Elevation Model (DEM) for Seattle that covers all of King County, Washington:
https://noaa-nos-coastal-lidar-pds.s3.amazonaws.com/dem/WA_King_DEM_2016_8589/index.html
Inside this dataset is a set of GeoTIFF DEM tiles.
Instead of having a single TIFF image representing the entire King County area, it’s “tiled” into smaller square images in a regular grid. In my experience, you don’t need to look into this too deeply and Claude Code can reliably understand this format without you deeply investigating this.
Each GeoTIFF file is an image where each pixel encodes the elevation height at some point in our coordinate system covering Seattle. Since this particular dataset is collected using LIDAR, each pixel represents a ~3ft square area so it’s relatively high-resolution.
Here’s another dataset that covers almost the entire globe, but it has a ~30m square resolution:
https://portal.opentopography.org/raster?opentopoID=OTSRTM.082015.4326.1
Because it’s a lower resolution, in areas where elevation changes drastically like mountains or hills, you might see some weird banding artifacts when rendered in 3D. If this is the case, you’ll have to play around with Claude Code to put in some smoothing logic that balances removing those banding artifacts while still retaining elevation detail.
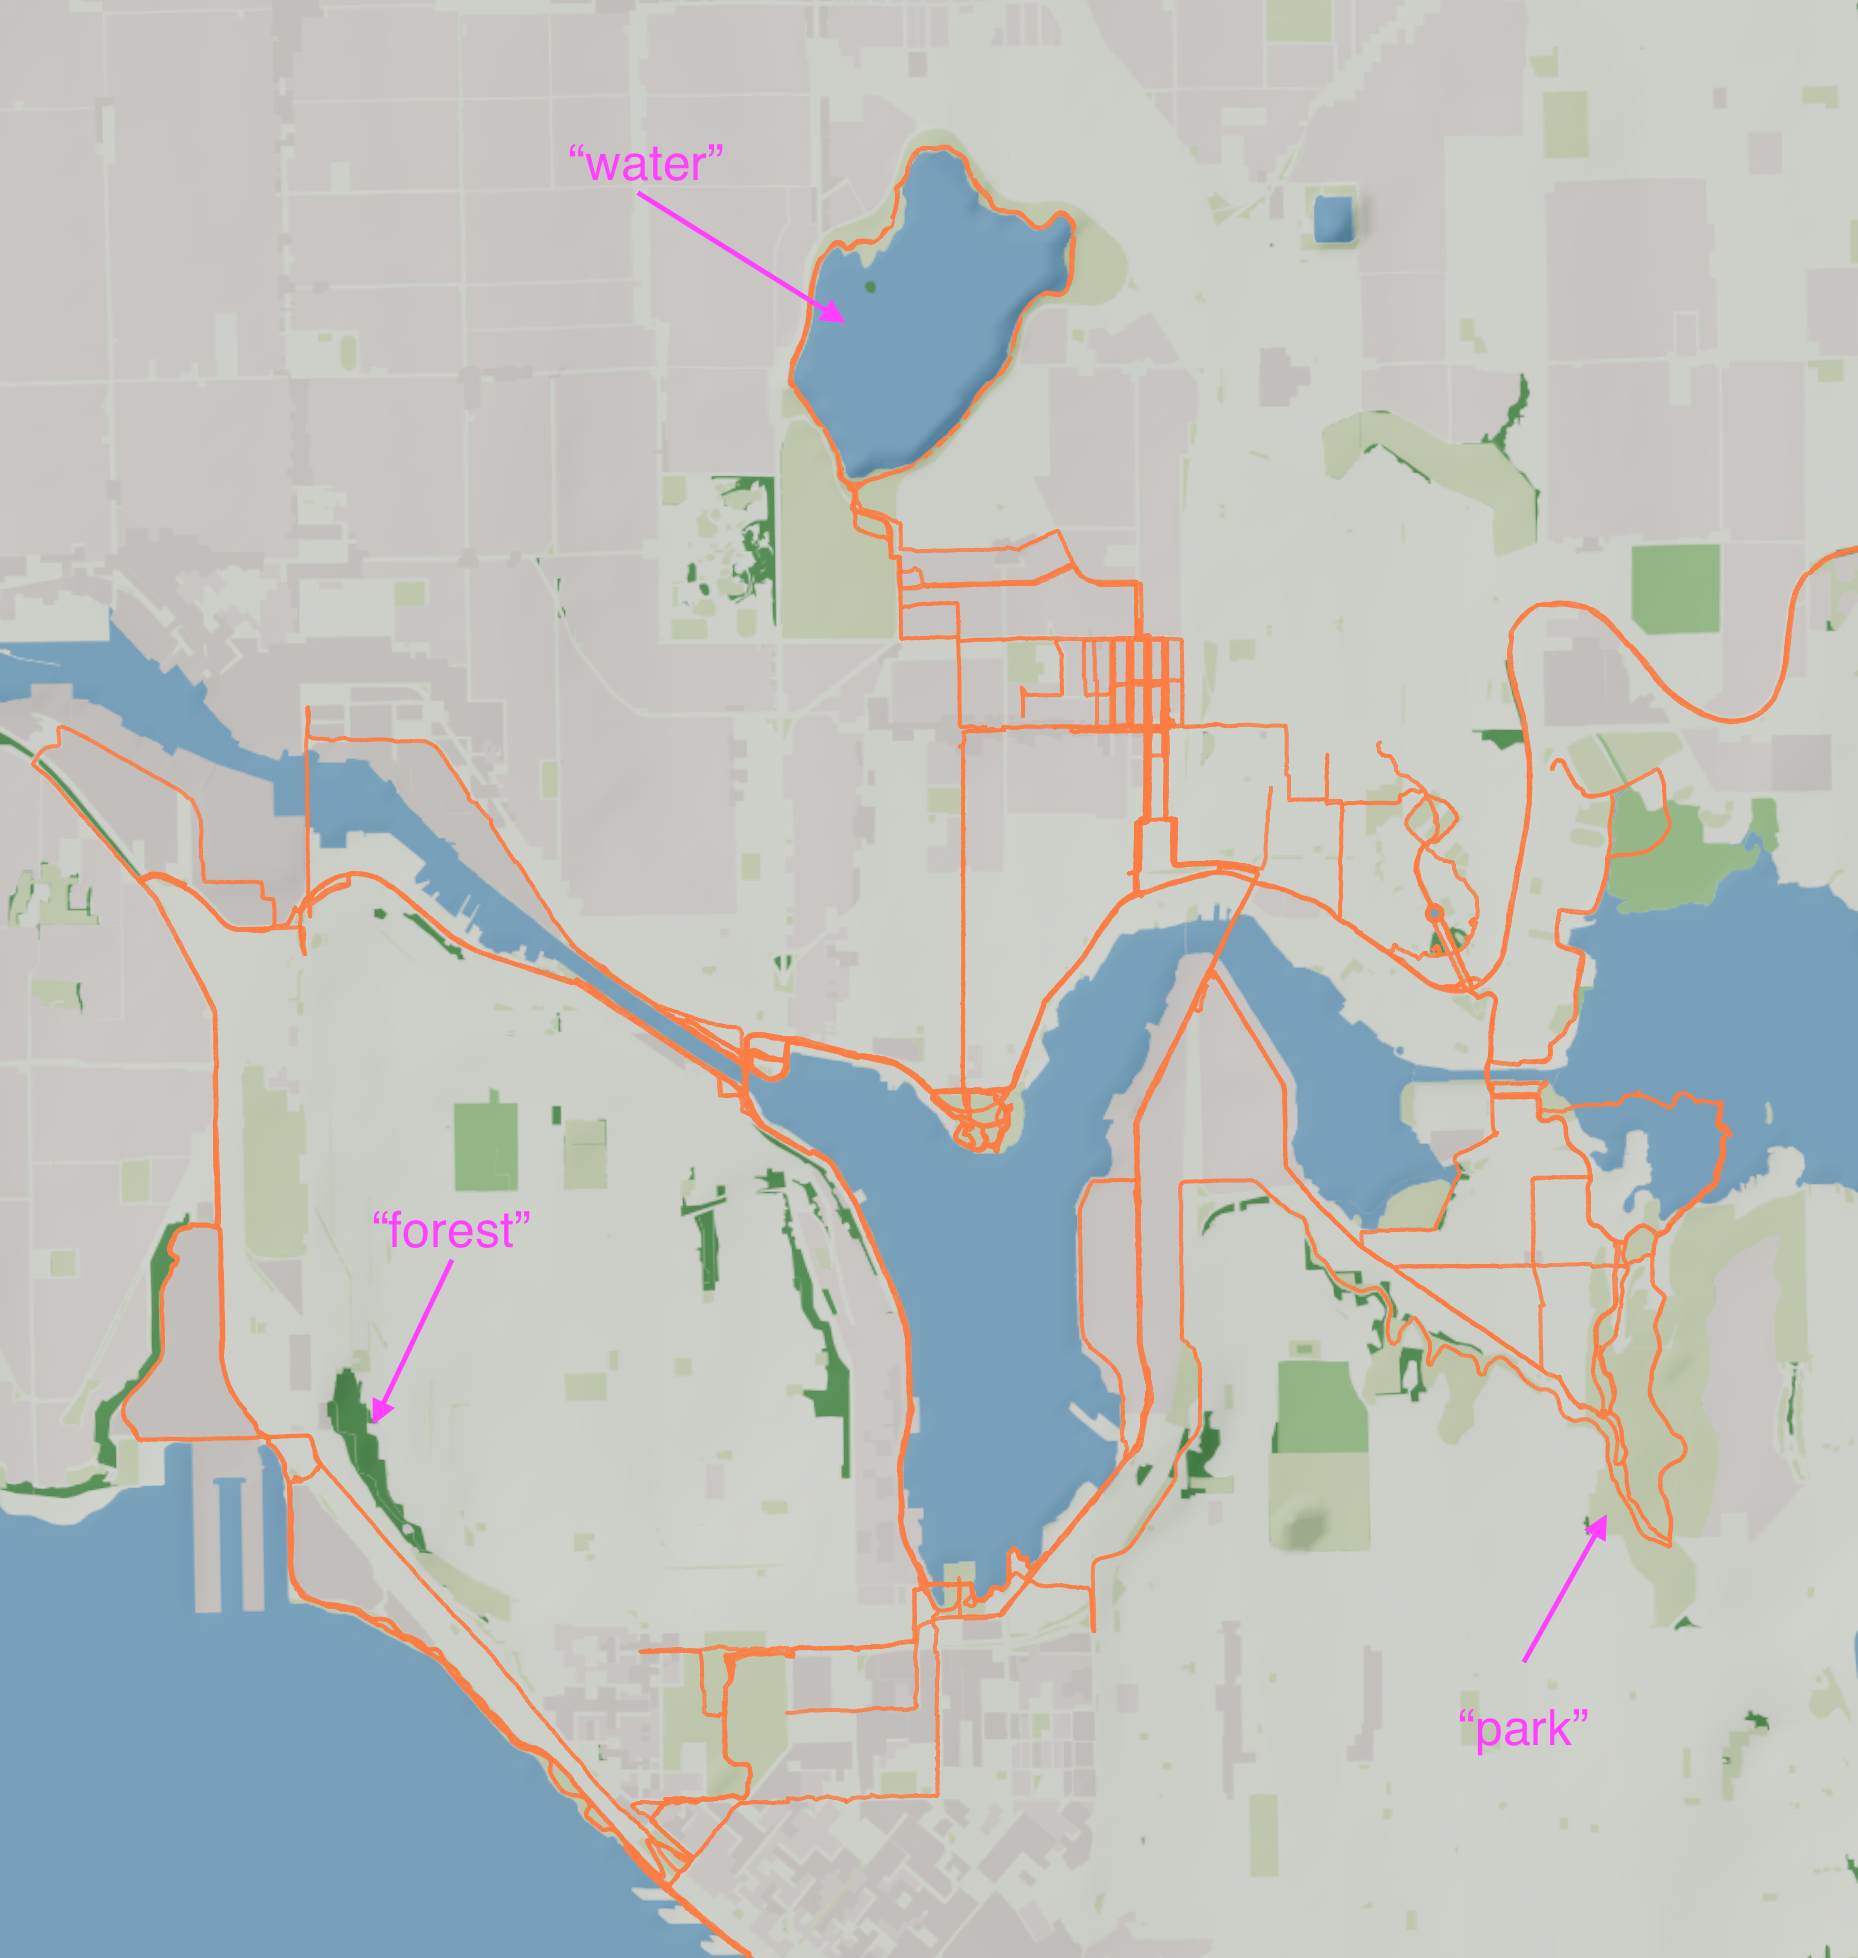
Landcover and Landuse Data
Landcover and landuse data is used for coloring our map with features like Parks, Residential Blocks, Lakes, and Forests.
OpenStreetMap (OSM) has this data open-source, but I had a hard time processing the raw file format correctly. Because of this, I used OpenMapTiles by Maptiler that preproccesses the OSM data into a cleaner data structure.
Putting it all together
At a very high-level, we doing two things to get this into an interactive map:
- preprocessing our raw data into a format that’s more easily consumable for ThreeJS
- rendering the transformed data into ThreeJS geometries
Here’s the high-level workflow:
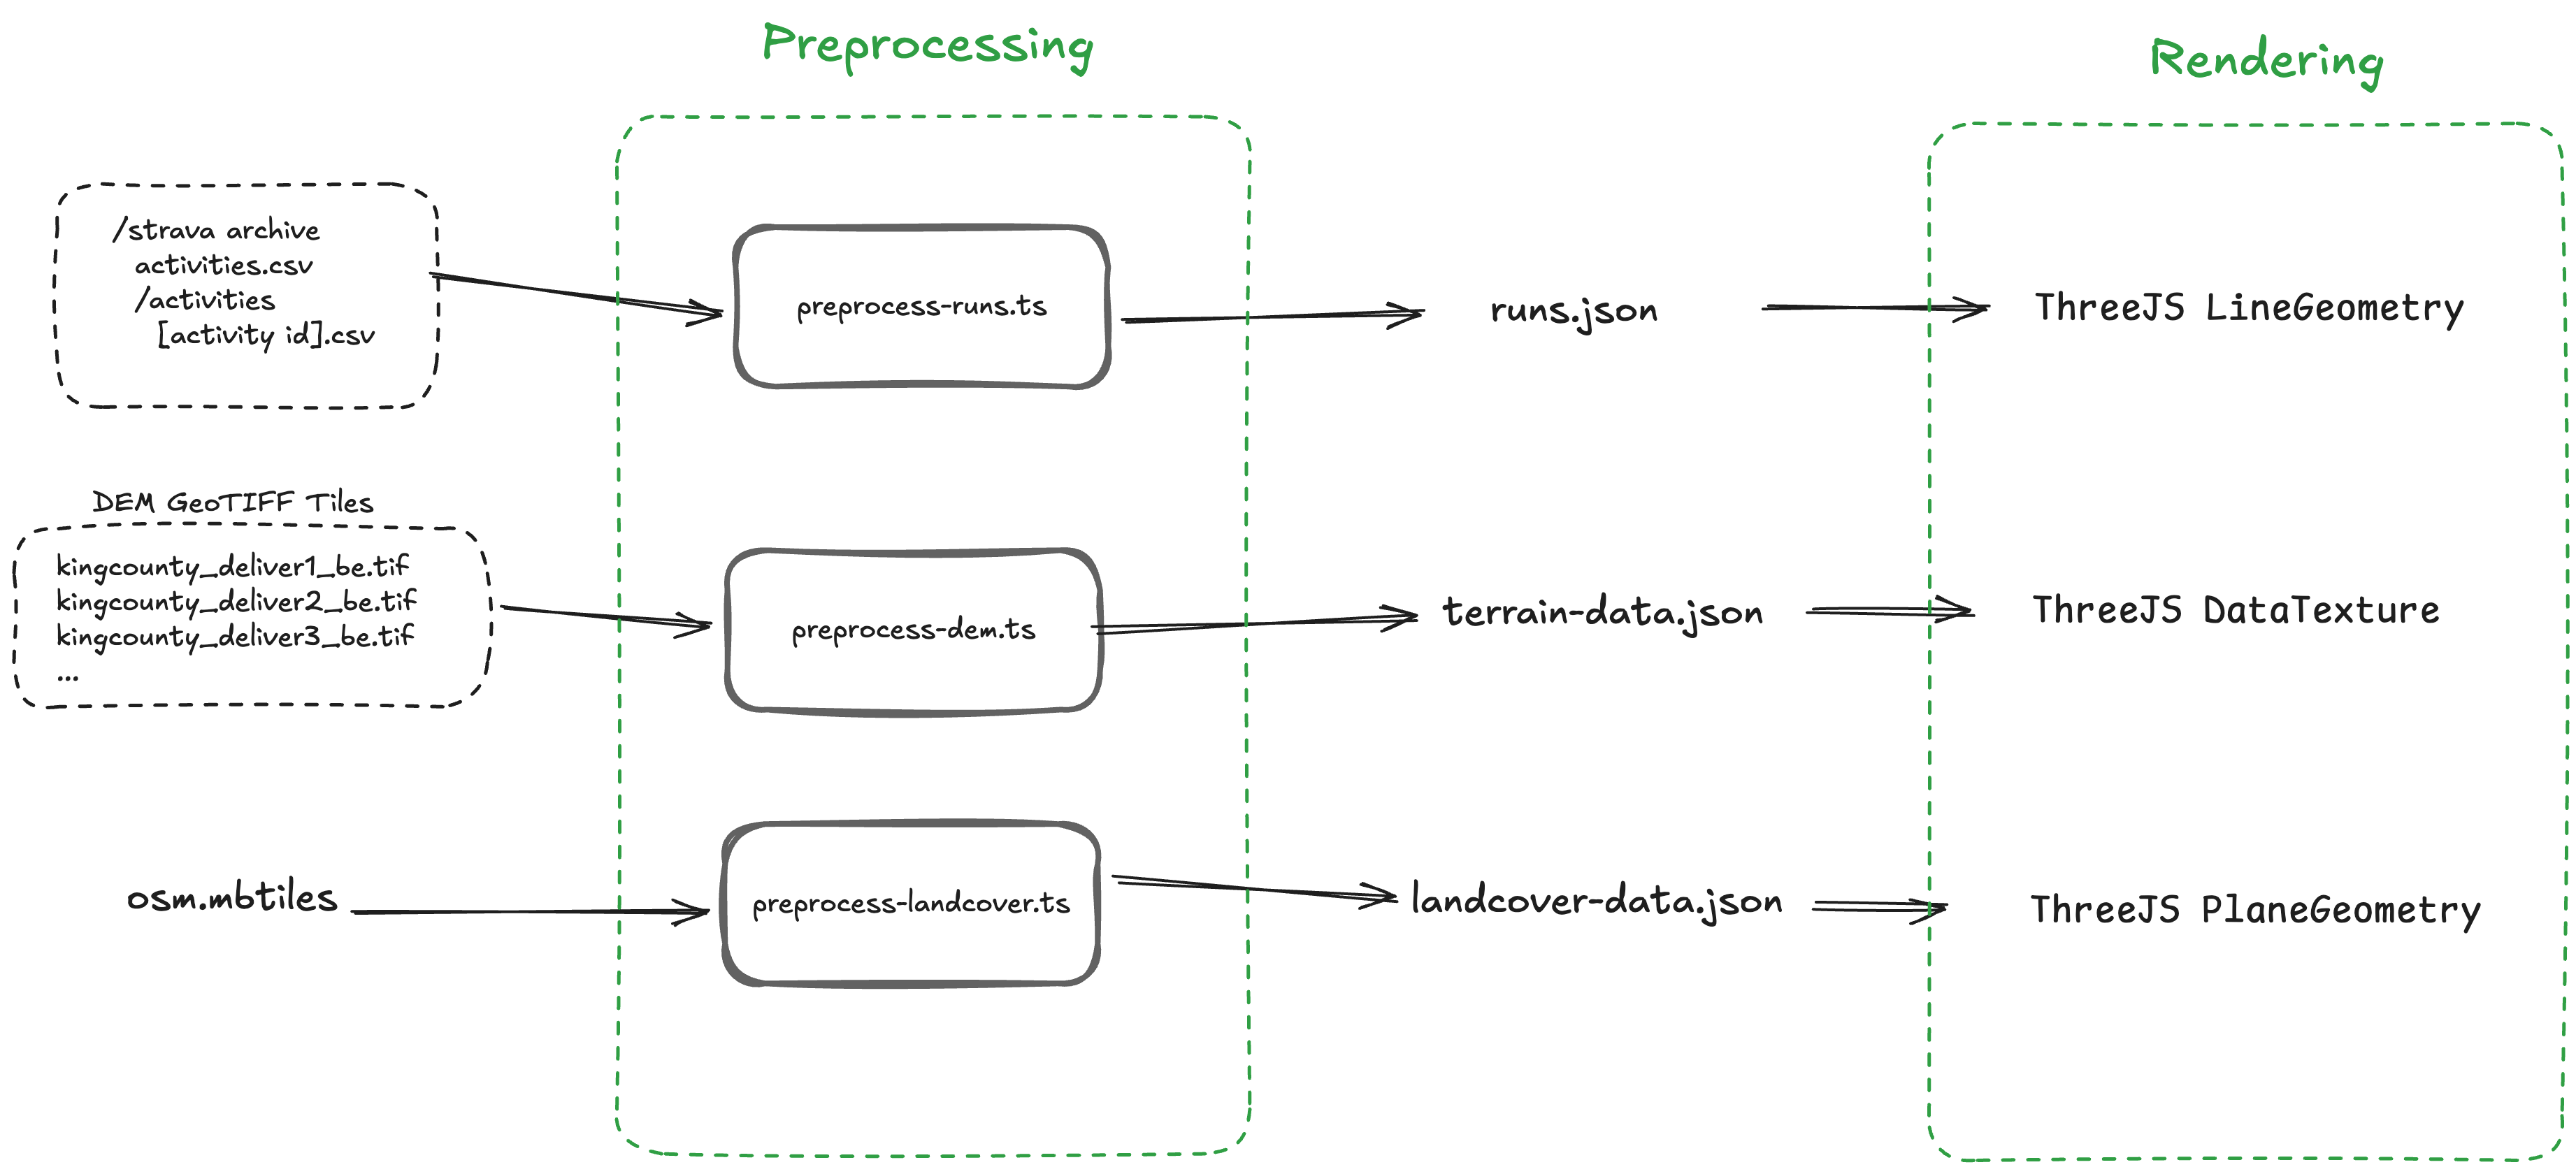
To be honest, this part just takes a lot of vibe coding with Claude Code to get it customized the way you’d like and getting all the coordinate systems to line up correctly. At least for me, it was a lot of trial and error since I didn’t dig too deeply into how mapping data should be processed, so I’m sure there’s more canonical ways of getting this to work instead of vibe coding it all.
But, the high-level strategy here though is turning the elevation map into a 3D surface in ThreeJS and then texturizing it with the landcover data and overlaying Lines with your running tracks on it.
Good luck!